Usage
This part of the documentation covers using Bosun’s user interface and the incident workflow.
Each alert definition has the potential to turn into multiple incidents (an instantiation of the alert). Incidents get a unique global ID and are also associated with an Alert Key. The Alert Key is made up of the alert name and the tagset. Every possible group in your top level expression is evaluated independently. As an example, with an expression like avg(q("avg:rate{counter,,1}:os.cpu{host=*}", "5m", "")) you can have the potential to create an incident for every tag-value of the “host” tag-key that has sent data for the os.cpu metric.
An incident gets created when the warn or crit expression evaluates to non-zero, or the alert goes unknown. Once an incident has been created it will notify users only when the lifetime severity of the incident increases. An exception to this is if you have set up notification chains, in which case the alert will send more notifications until someone acknowledges the alert.
Example:
avg(q(os.cpu{host=*} ...)) > 50. One of your hosts (web01) triggers the warn condition of the alerthigh.cpu{host=web01} and will have a current severity state of warn. Assuming a notification has been set up, the notification will be sent (i.e. an email)high.cpu{host=web01}).Incidents can be in one of the following severity levels (From highest to lowest):
crit is equal to in the alert definition is non-zero (true). It is recommend that “Critical” be thought of as “has failed”.warn is equal to in the alert definition is non-zero (true) and critical is not true. It is recommended that warning be thought of ha “could lead to failure”.The color of the major of the bar is the incident’s last abnormal status. The color that makes up the sliver on the left side of the bar is the incident’s current status.
The open incident filter supports joining terms in () as well as the AND, OR, and ! operators. The following query terms are supported and are always in the format of something:something:
| Term Spec | Description |
|---|---|
ack:(true|false) |
If ack:true incidents that have been acknowledge are returned, when ack:false incidents that have not been acknowledged are returned. |
ackTime:[<|>](1d) |
Returns incidents that were acknowledged before < or incidents that were acknowledged after > the
relative time to now based on the duration. Duration can be in units of s (seconds), m (minutes),
h (hours), d (days), w (weeks), n (months), y (years). If less than or greater than are not part
of the value, it defaults to greater than (after). Now is clock time and is not related to the time
range specified in Grafana. For example, ackTime:<24h shows incidents that were acknowledged more than 24 hours ago. |
hasTag:(tagKey|tagKey=|=tagValue|tagKey=tagValue) |
Determine if the tag key, value, or key=value pair. If there is no equals sign, it is treated as a tag
key. Tag Values maybe have globs such has hasTag:host=ny-* |
hidden:(true|false) |
If hidden:false incidents that are hidden will not be show. An incident is hidden if it
is in a silenced or unevaluated state. |
name:(something*) |
Returns incidents where the alert name (not including the tagset) matches the value. Globs can be used in the value. |
user:(username*) |
Returns incidents where a user has taken any action on that incident. Globs can be used in the value |
notify:(notificationName*) |
Returns incidents where a the notificationName is somewhere in either the crit or warn notification chains. Globs can be used in the value |
silenced:(true|false) |
If silenced:false incidents that have not been silenced are returned, when silenced:true incidents that have not been silenced are returned. |
start:[<|>](1d) |
Returns incidents that started before < or incidents that started after > the
relative time to now based on the duration. Duration can be in units of s (seconds), m (minutes),
h (hours), d (days), w (weeks), n (months), y (years). If less than or greater than are not part
of the value, it defaults to greater than (after). Now is clock time and is not related to the time
range specified in Grafana. |
unevaluated:(true|false) |
If unevaluated:false incidents that are not in an unevaluated state are returned, when
ack:true incidents that are unevaluated are returned. |
status:(normal|warning|critical|unknown) |
Returns incidents that are currently in the requested state |
worstStatus:(normal|warning|critical|unknown) |
Returns incidents that have a worst status equal to the requested state |
lastAbnormalStatus:(warning|critical|unknown) |
Returns incidents that have a last abnormal status equal to the requested state |
subject:(something*) |
Returns incidents where the subject string matches the value. Globs can be used in the value |
since:[<|>](1d) |
Returns incidents that in `status` more than < or incidents that in `status` less than > the
relative time to now based on the duration. Duration can be in units of s (seconds), m (minutes),
h (hours), d (days), w (weeks), n (months), y (years). If less than or greater than are not part
of the value, it defaults to greater than (after). Now is clock time and is not related to the time
range specified in Grafana.e.g. `status:normal AND since:<15d` return alerts that are in `normal` more than 15 day's |
The rule editor allows you to edit the the definitions in the RuleConf, preview rendered templates, and test alerts against historical data.
The text area will be loaded with the running config when the Rule Editor view is loaded. A hash of the config when you start editing it is saved. If someone else edits the UI and saves it, Bosun will detect that the config hash has changed and show a warning above the text area.
When you run test your version of the config is saved in Bosun, and you can link to it so others can see it.
The editor is built using the open source Ace editor.
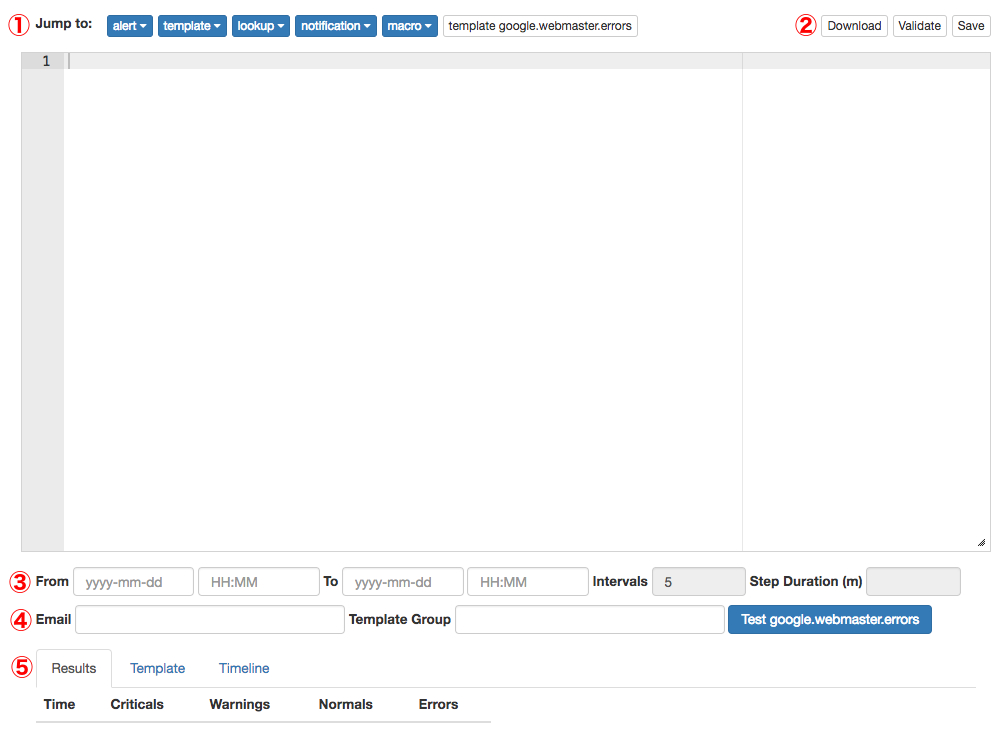
The Jump drop downs ① will take you to defined sections within the config. In particular, the alert drop down selects which alert will be used for testing.
At the end there is a switcher that can be used when you are working on an alert. It allows you to just back and forth between the alert and the alert referenced in the template.
The download button ② will download the config file as a text file. Validate makes sure that Bosun considers the config valid using the same validation that is required for Bosun to start.
The save button ② will bring up a dialogue that lets you save the config. This only appears if you have permission to save the config, and the system configuration’s EnableSave has been set to true.
The save dialogue will show you a contextual diff of your config and the running config. There are several protections in place to prevent you from overwriting someone elses configuration changes:
If the config file is successfully saved then Bosun will reload the new definitions. Alerts that are currently being processed will be cancelled and restarted. In other words, a restart of the Bosun process is not required for the new changes to take effect.
An external command to run on saves can also be defined with the CommandHookPath setting in the system configuration. This can be used to do things like create backups of the file or check the changes into version control. If this command returns a non-zero exit code, saving will also fail.
In all cases where a save fails, a reload will not happen and the save will not be persisted (the definitions file will not be changed).
Alerts can be tested before they are committed to production. This allows you to refine the trigger conditions to control the signal to noise and to preview the rendered templates to make sure alerts are informative. This done by selecting the alert the from the Jump Alert Drop down at ① and the clicking the test alert button at ④.
There are two ways you can test alerts:
Which behavior is used depends on the From and fields at ③. If From is left blank, that a single iteration is tested with the time current time. If From is set to a time and To is unset, a single iteration will be done at that time. When doing single iteration testing the Results and Template ⑤ tabs at will be populated. The Results tabs show the warn/crit results for each set, and a rendered template will be show in the Template tab.
Which item from the result set that will be rendered in the Template tab is controlled by the Template Group field at ④. Which result to use for the template is picked by specifying a tagset in the format of key=value,key=value. The first result that has the specified tags will be used. If no results match, than the first result is chosen.
Tip
When working on a template it is good to set the From time to a fixed date. That way when expressions are rerun they will likely hit Bosun's query cache and things will be faster.
The Email field at ④ makes it so when an alert is tested, the rendered template is emailed to the address specified in the field. This is so you can check for any differences between what you see in the Template tab.
Setting both From and To enables testing multiple iterations of the selected alert over time. The number of iterations depends on the setting to the two linked fields Intervals and Step Duration at ③. Changing one changes the other. Intervals will be the number of runs to do even spaced out over the duration of From to To and Step Duration is how much time in minutes should be between intervals. Doing a test over time will populate the Timeline tab ⑤ which draws a clickable graphic of severity states for each item in the set:
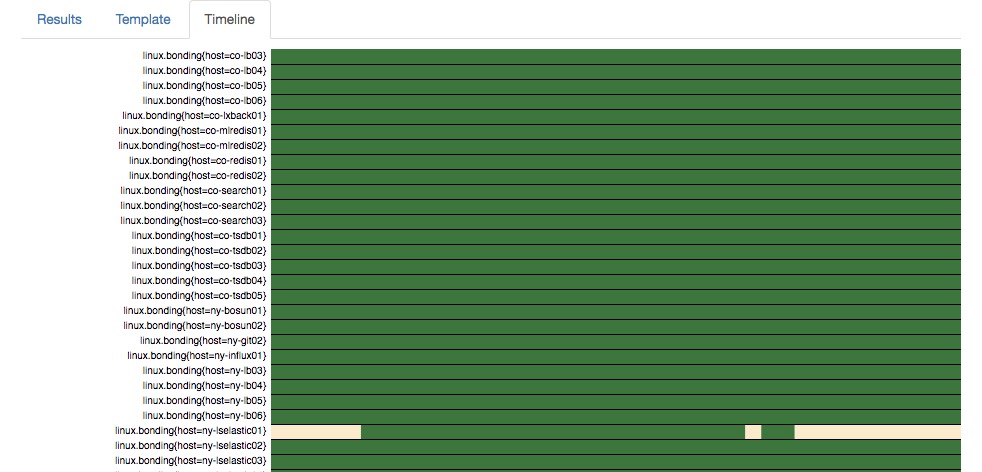
Each row in the image is one of the items in the result set. The color squares represent the severity of that instance. The X-Axis is time. When you click the a square on the image, it will take you to the event you clicked and show you what the template would look like at that time for that particular item.
Annotations are currently stored in elastic. When annotations are enabled you can create, edit and visualize them on the the Graph page. There is also a Submit Annotations page that allows for creation and editing annotations. The API described in this README gets injected into bosun under /api/ - you can also find a description of the schema there.